(This article is part of the JMeter Series)
Purpose of JMeter
JMeter is a testing tool. It comes accross as a graphical tool, where you can half visually half through text define your test. Its roots seem to lie in web testing - that means testing a website on how long it takes to return pages, how well it does under stress, how well it scales with increasing numbers of parallel requests etc.
However JMeter can be both used non-visually and has extended far beyond web testing.
Stability of JMeter
While working on a test with JMeter 2.3.4 it has had a multitude of stability problems:
- running out of heap space and crashing
- running out of heap space while testing and thus not being able to correctly execute and finish tests
- hanging and not being responsive any more
- not being able to terminate its internal threads
- not terminating launched outside processes
- while saving the work damaging the saved file itself and rendering it unreadable and thus loosing the work
That means that you can expect JMeter to hang or crash at any point while developing, executing or saving your tests.
That means that you should really be saving (CTRL-S or Apple-S) very often. On the other hand saving often will increase the likeness of your save file itself being destroyed and your work lost (see last point above). Thus saving is not enough - you need to version your work too, in order to be able to access older versions, that are not damaged.
Running something like this from a Unix command line should be saving revisions of your current work file - you’ll need to be saving your work continuously though:
  $ revision=99
  $ save_interval=300 # seconds
  $ work_file="Load Test.jmx"
  $ while true; do
  >    cp "$work_file" "$work_file.$revision"
  >    echo "Saved "$work_file" under "$work_file.$revision"
  >    sleep $save_interval
  >    if [ "$?" != 0 ]; then break; fi
  > done
One problem that does not seem to be resolved within JMeter at all is “big” requests. The various Samplers seem allways to put whatever the get from the test target into memory. Thus doing tests on multimedia content with gigabyte sized files will make JMeter run out of memory. There does not seem to be a way to tell JMeter to throw away downloaded content and/or to treat it in flight and not to save it in its entirety.
Documentation
The online JMeter documentation is brief and is rather just mentioning features than describing them in depth. Also, it’s not easy at all to find ready made examples that demonstrate syntax and finer points of how to use JMeter. When accessing the help coming with JMeter itself the JMeter instance would just hang.
I did a lot of searching the web, without much success and a lot of trying.
Debugging
What do you do when tests don’t run the way you want or do unexpected things? Then you need a way to debug them. There are three debugging facilities of JMeter, that are not hard to access:
- the Debug Sampler
- the JMeter log file
- the various Listeners
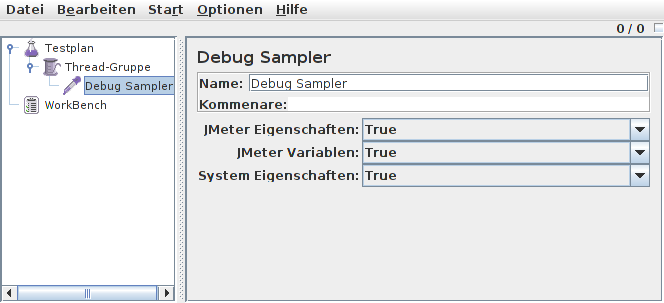
Here’s a snapshot of the Debug Sampler:

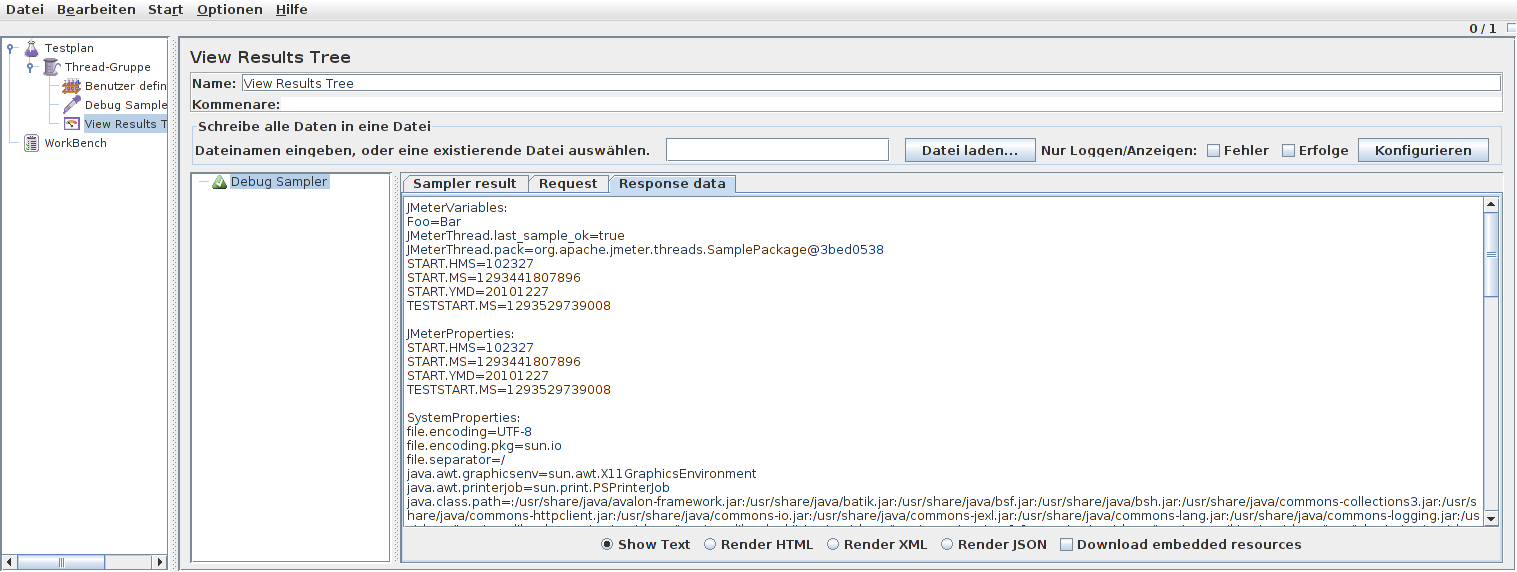
And a snapshot of the Debug Sampler displaying JMeter properties inside the “View Results Tree” Listener.

These facilities are very useful, however the various JMeter elements themselves are blackboxes - there seems to be no way to introspect them or “step through” them at runtime. When they “don’t work”, then either they might display something useful inside the JMeter Log or possibly you’ll be able to collect hints of why they might not work after they’ve run through the Debug Sampler results. If both approaches fail, then it’s not clear what else can be done other than pluging into the source code of JMeter itself.
Complexity
I’d describe working JMeter as “to do easy things is non-trivial and doing hard things is extremely demanding”
The various testing elements, such as “Logic Controllers”, “Listeners” etc. seem to have different scopes and different orders of execution.
“Listeners” for example seem to be global in scope, in that they “see” and can react on whatever happens in the whole of JMeter. They might be possibly limited to a “Thread Group” though, depending on where they are placed - I did not try to find out.
Doing slightly more complex things - such as a loop to repeat a row of steps multiple times, or executing external scripts does not seem to be supported within JMeter itself - one needs to ressort to nearby tools such as the Bean Shell and accordingly to learn the syntax and the working of that tool as well.
Same goes for “Extractors” which refer to a nearby tools that do Perl regexes or XPath matching.
In short to do even rather easy tests one needs to get to know a vast array of tools and syntaxes and how those various tools interact with each other.
The pros
All those negative points seem to weight quite heavily and they do. However after quite a lengthy and steep learning curve JMeter as a tool starts showing its strength. Once one has resolved a larger number of problems, adding more steps and functionality to JMeter starts getting easier and one productivity starts to increase.
It’s also fun working with such a complex, versatile and powerful tool and it’s fun to work with a tool that starts from a fresh and different perspective how to solve (visually) problems.
Conclusion
One thing that one gets for “free” with JMeter is the nice reports generated by the various included Listeners. It’s something that will certainly impress management and is useful for gaining a high level understanding of the performance of a web-site.
Other things - like traversing web sites, extracting and matching information might be just as well done with specialised tools coming along with Python, Ruby or command line tools available under Unix.
Ease of automation when using proper scripting languages and their effectiveness and efficiency will be hard to beat given that one allready has a good working knowledge of them.
To me it’s not really clear whether using a scripting language for the task of testing and profiling is not more efficient and more flexible than using JMeter.
However I do reccomend JMeter: it’s fun to work with and it does give a new perspective on how things can be done.
Update 10.Nov. 2011
It was pointed out to me by Aleksandar Kostadinov that the default graph created by JMeter can be quite chaotic. He recommends the StatAggVisualizer graphing plugin instead.
Tomáš Pospíšek, 28.12.2010